Pgiam/iStock via Getty Images
Investment Thesis
This article will use TechTarget, Inc. (NASDAQ:TTGT) as an illustration of our ongoing search for the most likely identification of near-term capital gain prospects and their capital loss risk potentials.
We employ behavioral analysis to identify the prospects of gain and loss for individual securities within forecast-able time horizons of multi-months rather than the multi-years normally used in 20th-century evaluations.
If you are new to this analysis, please temporarily explore this brief explanation.
BEHAVIORAL ANALYSIS
Changes in Communication, Competitive Techniques, Information Technology, Computation and Data Technology, Medical and other scientific technologies all have contributed to necessary evolution in the way securities evaluation needs to be conducted,
Most pervasive among the evolving technologies is the effect on speed of change and the shortening of time in which progress effects are experienced.
Technology advances in communications and information have transformed the way securities markets operate, and the way major investors behave as a result. Prices of equities now normally gyrate during one-year elapsed periods at rates in ranges that are typically several times the underlier’s trend growth.
Which means that during part of the year period their prices are retreating, and are consuming investments of time which cause the “growth” trend rates to be far less than what their better, shorter progress periods provide.
Advances in information technology encourage investment professionals (the market-making [MM] community) to protect the capital they must put at risk to do their jobs. Those actions cause the markets for equities and derivatives to become more integrated than they were in much of the 20th century.
So we study what the Pros’ behavior causes to happen in the price-change “insurance” derivatives markets, to understand just how far it is reasonable to believe specific stock and ETF prices may move, both up and down, in the next few months.
This analysis has been conducted without material change daily for over a decade on more than 3500 widely-held and actively-traded stocks and ETFs. The resulting price range forecasts provide an actuarial history (unmatched elsewhere in the investment community) of subsequent market prices, as testimony to the strength or weakness of the forecasts made earlier.
Near-term price gains are most important to investors who are now either starting out in building a portfolio’s wealth and exploring how it may best be done, or to investors who have come to realize that retirement plans made years earlier are unlikely to be met at current rates of investment wealth accumulation.
Active investing, where capital is constantly put to work in the best odds-on situations to deliver profit within foreseeable time horizons, is the strategy most likely to produce what is needed now, at least risk. But active investing needs guidance as to what to do, when to do it, and with what intensity.
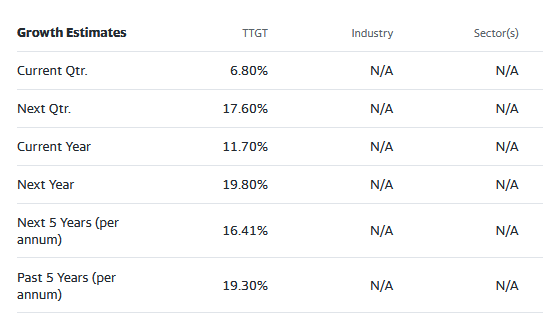
Company Description, Growth outlook
TechTarget, Inc., together with its subsidiaries, provides marketing and sales services that deliver business impact for enterprise technology companies in North America and internationally. It also provides purchase-intent marketing and sales services for enterprise technology vendors; and customized marketing programs that integrate demand generation and brand advertising techniques. TechTarget, Inc. was incorporated in 1999 and is headquartered in Newton, Massachusetts.
Source: Yahoo Finance

Yahoo Finance
The Competitive Scene
Internet Business Services Stocks at this time are good vehicles for Active Investing as a strategy for several reasons. The information technology age continues to demand these tools with ever-expanding capacities for compute power, data storage, mobility, and accessibility.
Interim setbacks and failures keep opportunity valuations in flux among many enterprises. Physical development times and marketing efforts under government regulations and peer review progress vary across international boundaries. Competitive pressures from new organizations’ blossoming successes can impact established firms.
The investing result is that far more price-change activity for near-term capital gains and losses exists than is to be earned from 20th-century “long-term-trend growth and income” strategies. What is needed to capture the opportunities and minimize losses is a demonstrated perspective, stock by stock, of what range of market prices are being expected now and in the near future. The kind we find in volume-trade transaction behavior.
Thus, we have specific, honest unbiased forecasts of future price limits, both up and down, motivated by the self-serving competing interests of the participants in an open-market negotiation.
Those limits can help define prospective investment reward and risk on an issue-by-issue basis that is directly comparable between alternatives, regardless of their underlying competitive or economic circumstances. Those essential minutiae have been subsumed in the hedging negotiations.
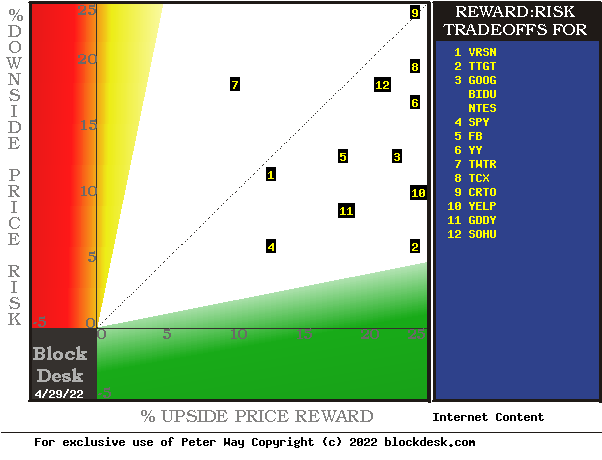
Figure 1 uses those forecasts in making comparisons of price Risk vs. Reward tradeoffs between alternative investments.
Figure 1

blockdesk.com
(used with permission)
Each stock is positioned in this map by its intersection of upside price change forecast on the green horizontal scale and experienced price drawdown exposures (on the red vertical scale) typical after prior forecasts like today’s. Any issue located above the dotted diagonal has more potential risk than return at its present price.
A market-reference norm by SPY is at location [4]. Notably, none of the marketing services stocks has less downside risk than SPY, but most of them have higher reward prospects. The most opportune on a reward-to-risk basis is [2], TTGT.
Since price-change risk is a dynamic, not a constant, in time these exposure relationships will change. It is these changes that provide fresh opportunities for active investment capital gains on a shorter-term recurring basis. Besides just the downside price exposure, there may be other investment attributes investors will want to consider. Figure 2 provides some of these.
Figure 2

blockdesk.com
(used with permission)
The price-range forecast limits of columns [B] and [C] get defined by MM hedging actions to protect firm capital required to be put at risk of price changes from volume trade orders placed by big-$ “institutional” clients.
[E] measures potential upside risks for MM short positions created to fill such orders, and reward potentials for the buy-side positions so created. Prior forecasts like the present provide a history of relevant price draw-down risks for buyers. The most severe ones actually encountered are in [F], during holding periods in effort to reach [E] gains. Those are where buyers are most likely to accept losses.
[H] tells what proportion of the [L] sample of prior like forecasts have earned gains by either having price reach its [B] target or be above its [D] entry cost at the end of a 3-month max-patience holding period limit. The pink backdrop of Sample Size [L] for GOOG is a warning of the inadequacy of prior forecasts to assure credibility of the history recorded from only one forecast when dozens, like those of other stocks in Figure 2 may be available. In GOOG’s case the -7 Range Index notes its current price is significantly below the bottom of current hedging forecast.
Further pink-warnings of poor [T] reward-to-risk ratios should be noted for TWTR due to that issue’s unusual activity.
[I] gives the net gains-losses of those [L] experiences and [N] suggests how credible [E] may be compared to [I].
Further Reward~Risk tradeoffs involve using the [H] odds for gains with the 100 – H loss odds as weights for N-conditioned [E] and for [F], for a combined-return score [Q]. The typical position holding period [J] on [Q] provides a figure of merit [fom] ranking measure [R] useful in portfolio position preferencing. Figure 2 is row-ranked on R among candidate securities, with TTGT in top rank.
For perspective, along with the candidate-specific stocks these selection considerations are provided for the averages of over 3300 stocks for which MM price-range forecasts are available today. The 20 best-ranked (by fom) of those forecasts, and the forecast for S&P500 Index ETF as an equity market proxy may also be noted.
TTGT’s bp/day prospect of 36 bp/day when compounded over a 252 market-day year, adds up to the 180% gain in [K] if sustained for a year. But its next 3-month high price target of $82.70 at +23% above the forecast-current price of $67.31 leaves the remaining +150% to be compounded from other selected investments able to achieve gains at the same 36 bp/day rate in the remaining 216 market days of the year, if it takes the prior average of 34 days to earn this +23%.
All those ifs are what make it easier to keep score by simply adding up the realized bps and the days required to achieve them, then to divide one by the other to derive an average CAGR for your portfolio.
Among the 20 best-ranked of all 3,226 of today’s MM price-range forecasts, their high Win Odds (89 of 100) and short holding periods (37 days) boost their average CAGRs to 267%. Here TTGT compares rather favorably at +180% in contrast to the MM-forecast population CAGR of 19% and that of SPY at +27%.
Recent Trends in TTGT Price-Range Forecasts
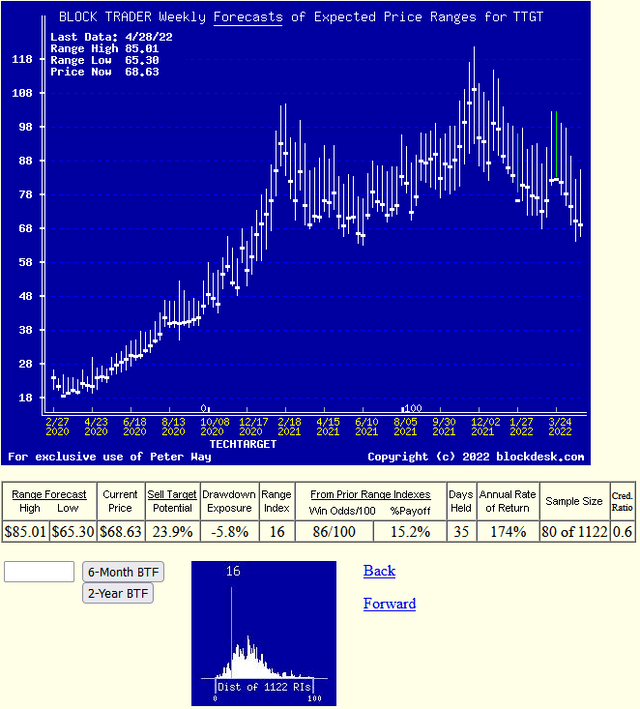
Figure 3 shows the daily MM hedging-implied price-range forecasts of the past 2 years as vertical lines. Unlike “technical analysis charts” solely of past prices these are forward-looking expectations of prices yet to come in the next few months. They are the once-a-week selections of forecasts made daily during the past two years.
Each forecast is divided into upside and downside price change prospects by the heavy dot of the stock’s market close price on the day the forecast was made. These are records of direct expressions of what is reasonably being expected and where capital has been put at risk, not some hypothetical hopes of past price repeats.
Figure 3

blockdesk.com
(used with permission)
The small picture at the bottom of Figure 3 presents the past 5 years’ daily record of where the market quotes split each forecast into upside and downside proportions. The current Range Index of 16 indicates that about one sixth of the full forecast range is to the downside, and over five sixths is to the upside. TTGT’s typical appraisals have averaged much higher than the present outlook, an indication of likely coming higher price.
Conclusion
The above comparison of TechTarget, Inc. with its best competitors indicates a buy in the stock at this time should provide capital gain satisfactions in the next few months.
